
Analytics
Change detection between two dates
Send us an area and two dates. We compare imagery of the two and return each change as its own polygon, so you can measure it and check it against the imagery.
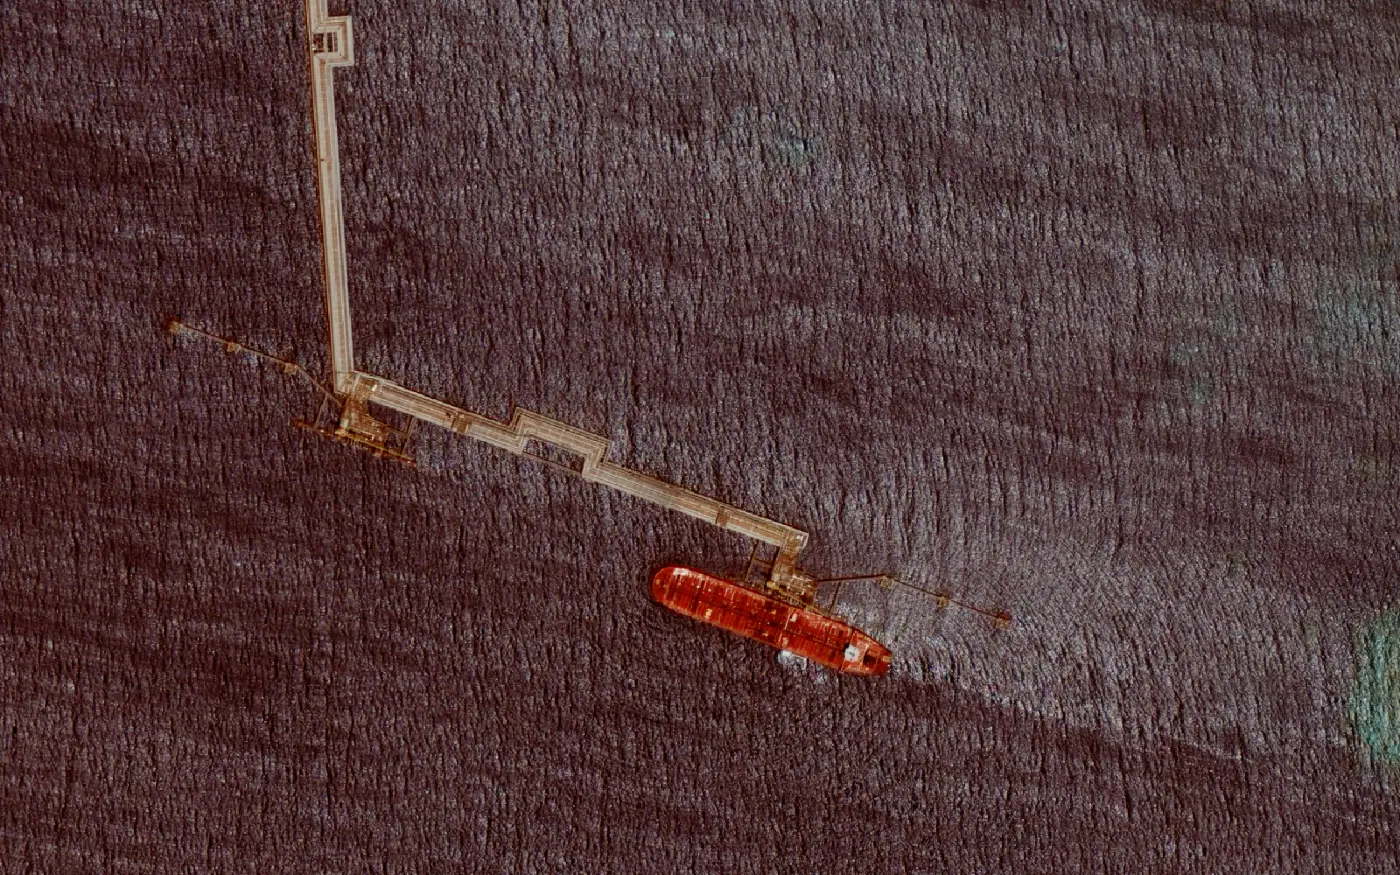
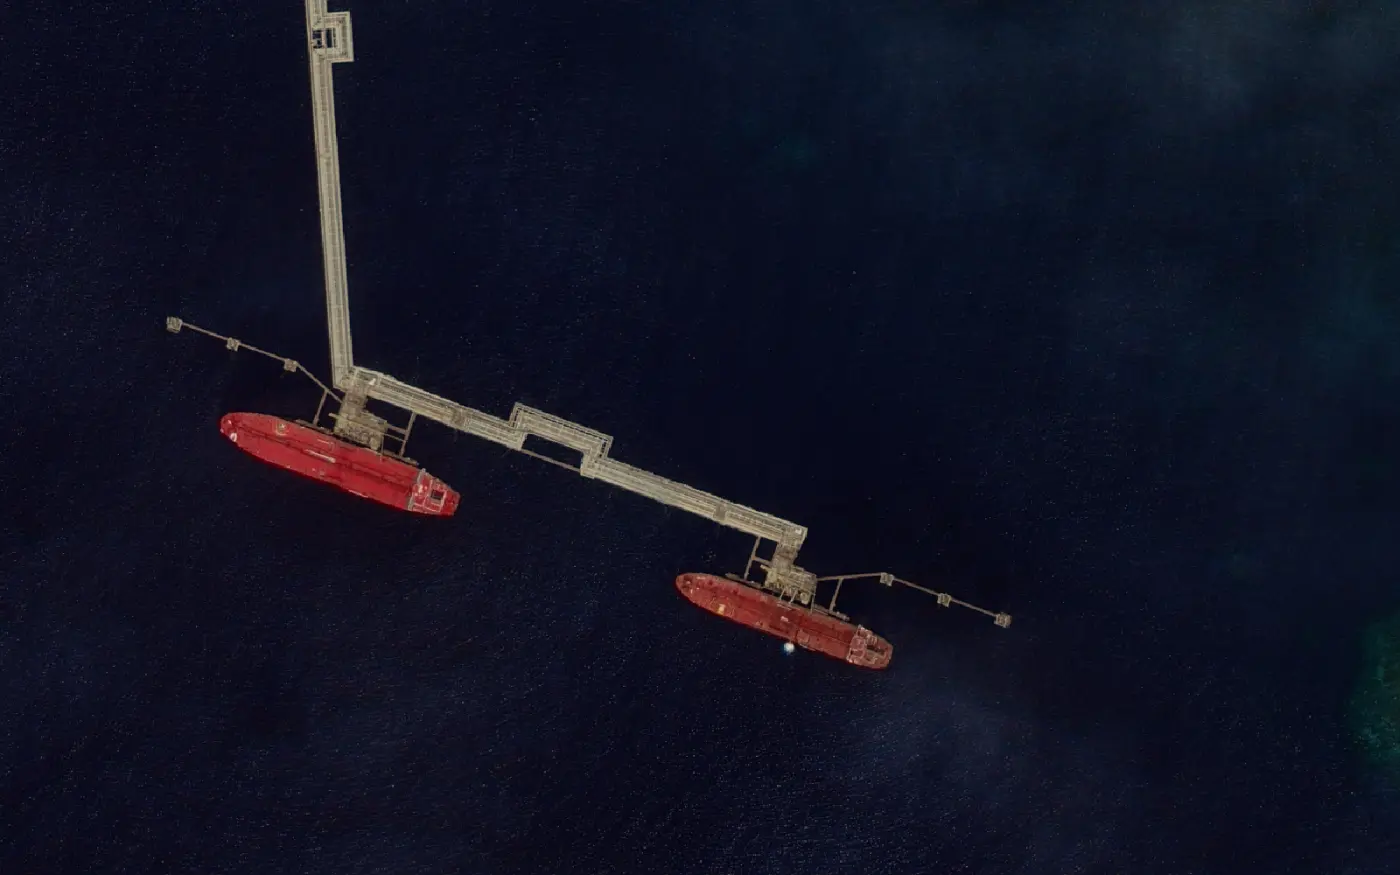
What to send us
The area, as a boundary file or drawn on a map, and the two dates you want compared. If you only know the period, give us that and we'll look in the archive for a clear scene near each end of it. If the later date is still to come, we can task a new capture for it.
Tell us what you're watching for, too. It decides which sensor and resolution the job needs.
What comes back
A polygon for each area that changed between the two dates, outlined object by object.
Before the comparison runs, both dates go through the same processing, and alignment between them is typically sub-pixel. That keeps a small shift between the two images from being counted as a change on the ground.
How it's priced
Each job is quoted. The imagery is charged at the published per-km² rates, which step down for larger areas. Pricing →
For the method in general, and which satellites suit which kind of change, read our guide. Satellite change detection →
What changed on your site since last year?
Send us the area and the dates and we'll quote the job.