
Satellite elevation models
Elevation models of your site, included with the stereo imagery
Every stereo order comes with a 0.5 m surface model (DSM), a bare-earth terrain model (DTM) and the height of everything standing on the ground. All three are built from the same 30 cm images you receive, so they line up with your imagery.
We checked the terrain model at Kimberley, South Africa, against 80,050 ground measurements from NASA's ICESat-2 laser. On passes held out of the fit, the spread (NMAD) is 0.18 m.
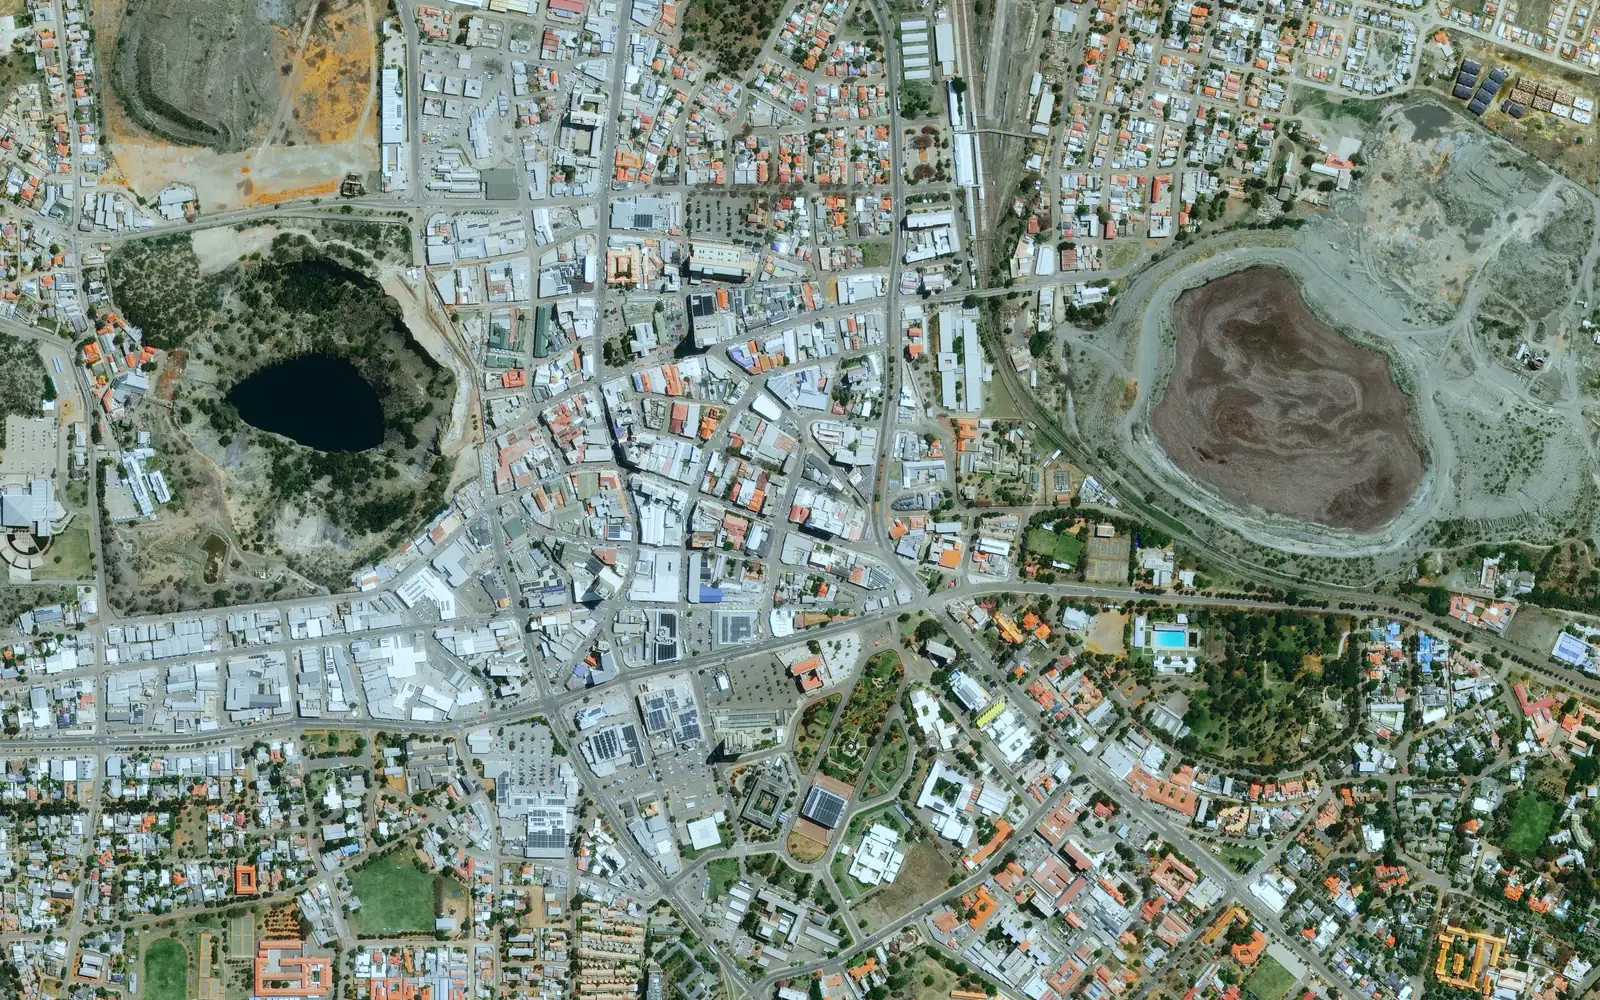
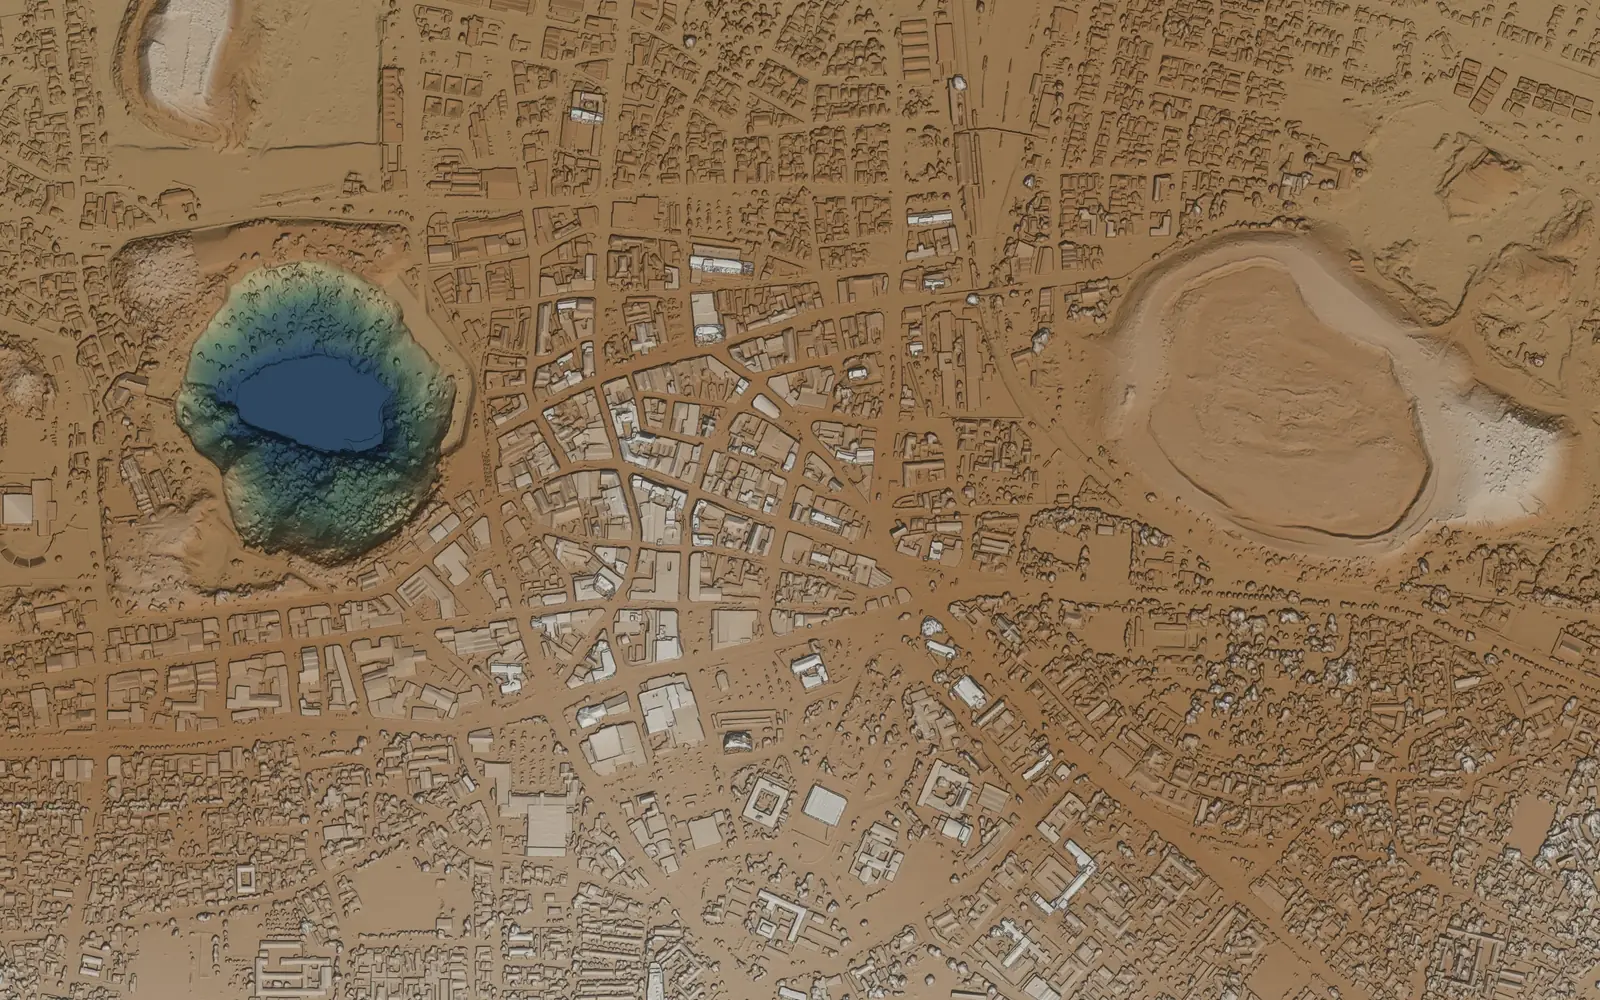
Ask for a DEM and you could mean either of two surfaces
People say DEM for the top of everything and for the ground underneath. They answer different questions, so a stereo order includes both, plus the height of whatever stands between them.
DSM
Surface model
Everything the satellite saw from above, including roofs, tree canopy, stockpiles and the open ground between them. Use it for stockpile volumes, line of sight and 3D context for design work.
DTM
Terrain model
The ground itself. Buildings and vegetation come off, and the ground under them is filled from measured ground nearby. Heaps, embankments and pit walls are terrain, so they stay. Use it for drainage and flood modelling, earthworks and contours.
nDSM
Height above ground
The surface model minus the terrain model, which gives you the height of every building, wall and tree. Use it for building heights, and for vegetation clearance along power lines, rail and roads.
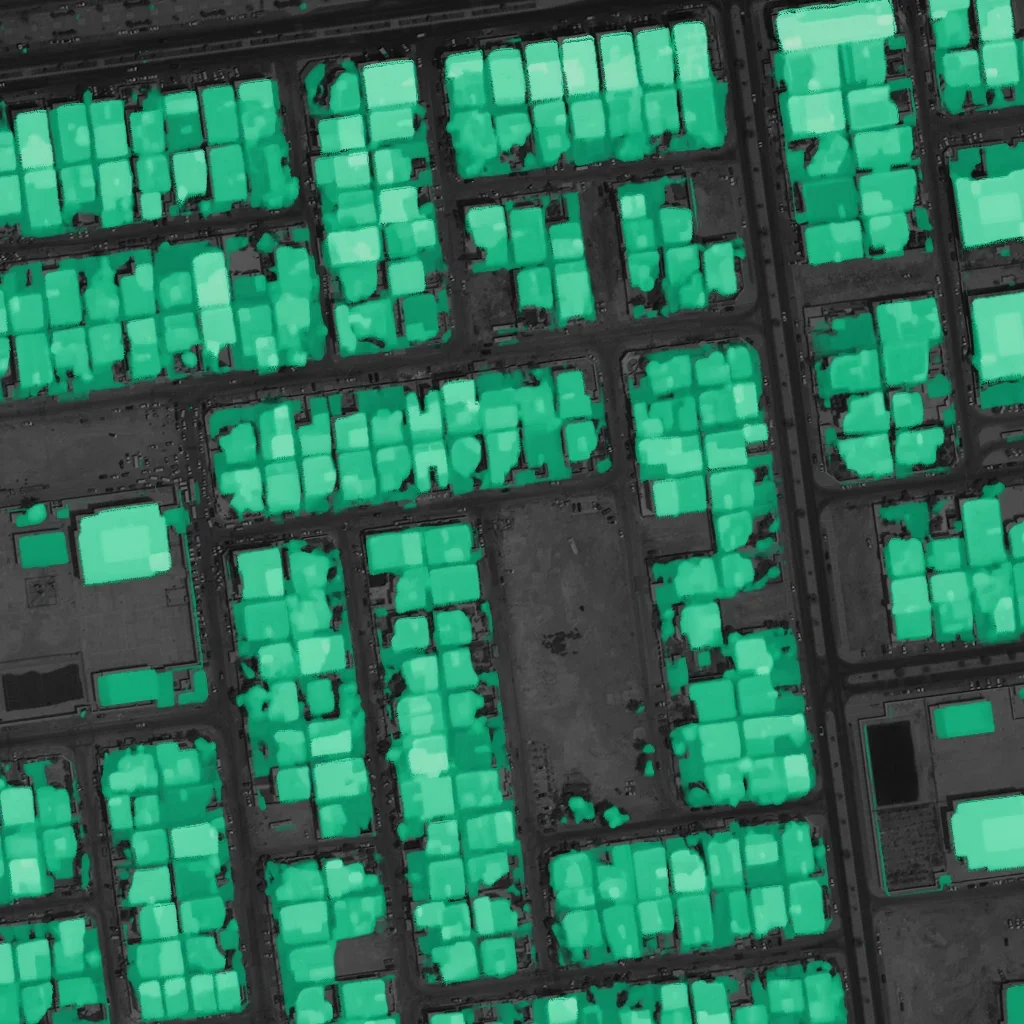
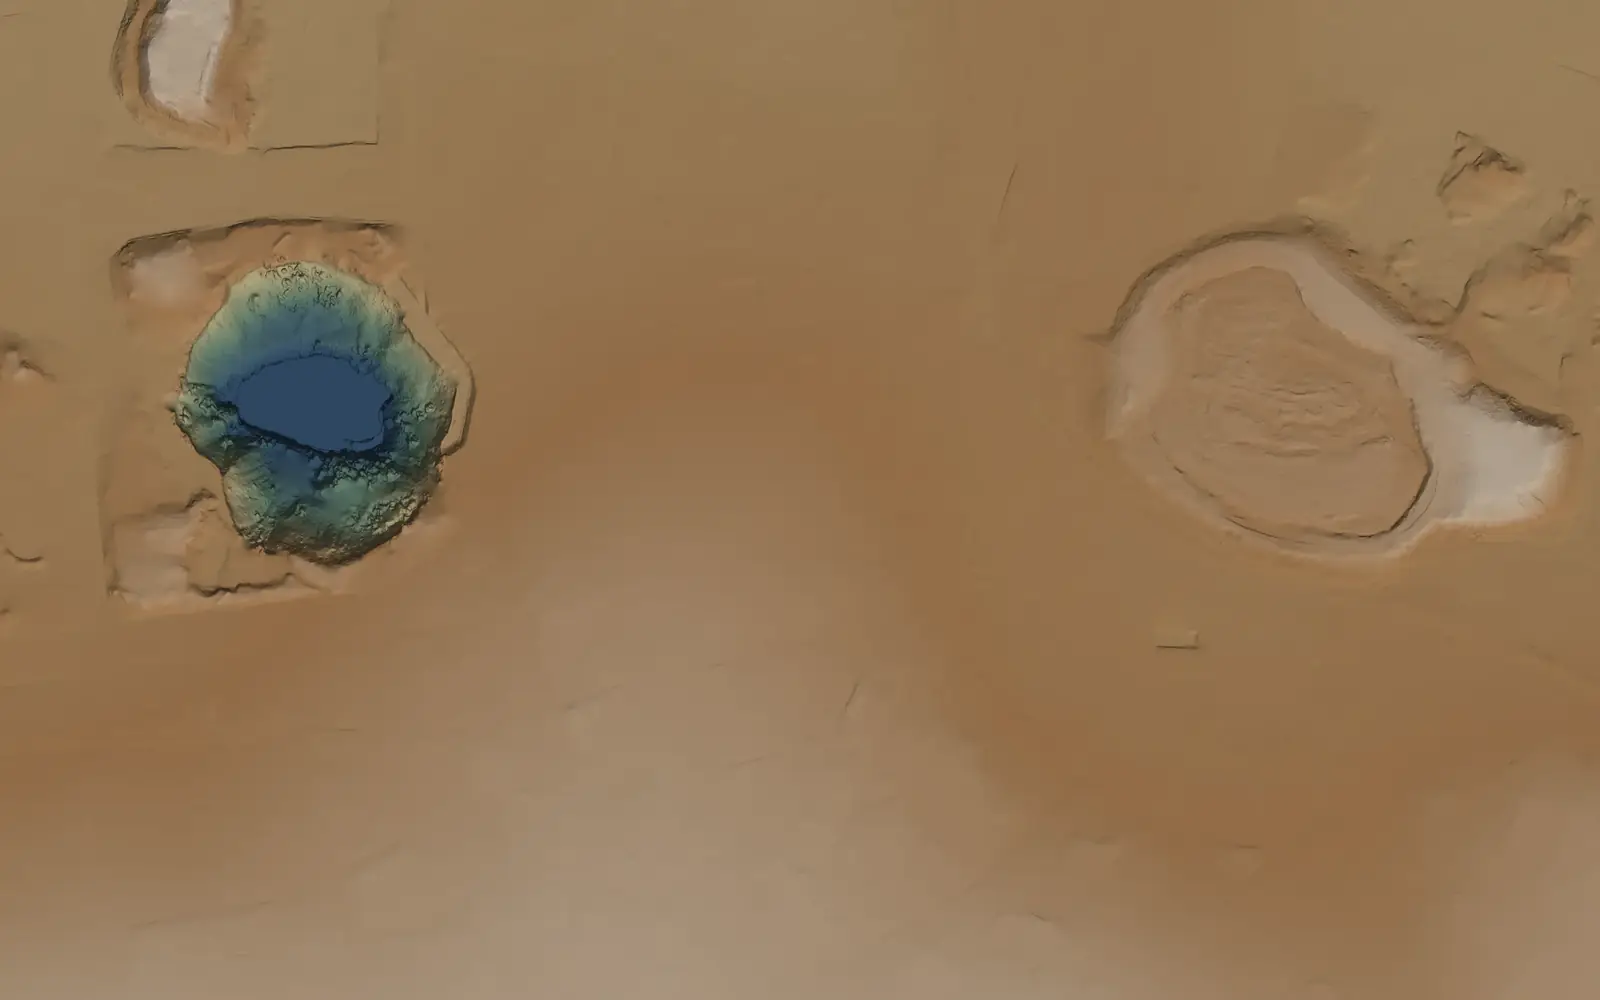
What the terrain model takes out, and what it keeps
Every layer on this page comes from one stereo pair covering 280 km²: two 30 cm images of the same ground, taken 44 seconds apart. Switch layers below and drag the divider.
Houses, sheds and tree canopy are taken off, and the ground under them is filled in from the measured ground around them. The flooded pit, its walls and the mine dumps are real terrain, so they stay. A generic ground filter will often flatten those along with the buildings.
Accuracy
How close is the terrain model to the ground?
NASA's ICESat-2 satellite measures ground height with a photon-counting laser. We compared the Kimberley DTM with 80,050 of its ground segments, collected between January 2019 and May 2026, and broke the result down by what the DTM did to each cell.
- NMAD on held-out passes
- 0.18 m
- 27,433 segments
- Median offset on held-out passes
- +0.010 m
- DTM minus ICESat-2
- Range of block medians
- −0.22 to +0.25 m
- Over a grid of blocks across the scene
| Cells, by DTM reason code | ICESat-2 segments | DSM median | DTM median | DTM NMAD | 95% within |
|---|---|---|---|---|---|
| Ground as measured | 52,462 | 0.00 m | −0.004 m | 0.16 m | 0.38 m |
| Objects removed and their skirts | 10,187 | +0.56 m | +0.016 m | 0.16 m | 0.68 m |
| Under vegetation | 13,480 | +0.28 m | +0.032 m | 0.17 m | 0.62 m |
| Bumps and clutter removed | 2,064 | +0.19 m | +0.021 m | 0.22 m | 0.68 m |
| All segments | 80,050 | +0.06 m | +0.007 m | 0.17 m | 0.53 m |
The rows are the largest groups of cells, and the last row covers every segment we compared. The DSM column shows what the terrain model takes out: where there are roofs or canopy, the surface sits above the laser's ground and the DTM does not.
How the figures were measured
- We fitted a small tilt across the scene (0.8 m per km east, 0.6 m per km north) to ICESat-2 and removed it. That's why the headline figure uses passes held out of the fit: the tilt came from even orbit cycles, and the 27,433 odd-cycle segments are the test.
- NMAD measures spread in a way a few outliers cannot drag around. The root-mean-square error over all segments is 0.93 m, pulled up by a small tail on steep pit walls and dense scrub; 99% of segments are within 2.6 m.
- The floors of the deepest pits had no consistent stereo match. Those 19 ha are left empty in the delivery.
- ICESat-2 pins down horizontal position well from north to south. From east to west it's uncertain by about 1.5 m.
- These figures come from Kimberley, in the semi-arid Northern Cape. For forest or mountain terrain, talk to us before you order.
The same comparison is written into the README that comes with every delivery, so your team can check it for its own site.
The surface model against airborne LiDAR
Kimberley has no LiDAR, so we also tested Parallax, the stereo matcher that builds these models, on the IARPA MVS3D benchmark over San Fernando, Argentina. It put 46.8% of the LiDAR footprint within 0.5 m of the truth. The classical matcher in NASA Ames Stereo Pipeline managed 32.1%. Each model was registered to the LiDAR before scoring, so the test measures shape rather than absolute position.
San Fernando, Buenos Aires · 2014 to 2016 · 30 cm WorldView-3 · IARPA MVS3D LiDAR
The elevation models are included in the stereo price
Stereo imagery is priced per km² of your area, like everything on our price list. The DSM, DTM and height above ground come with it at no extra charge.
What arrives
- Surface model (DSM)
- 0.5 m grid from 30 cm stereo, heights in EGM2008
- Terrain model (DTM)
- Bare-earth heights, plus a reason-code raster for every cell
- Height above ground
- The DSM minus the DTM
- Accuracy report
- The ICESat-2 comparison by reason code, in the product README
- Imagery
- The stereo imagery itself, processed like any other order
- Formats
- Cloud-Optimised GeoTIFF with STAC metadata. Other formats, projections and tiling at no extra cost
| Stereo | Archive / km² | Tasking / km² |
|---|---|---|
| Vantor WorldView stereo 30 cm | A$75 min 5 km² | A$110 min 25 km² |
| Vantor WorldView-3 + SWIR stereo 30 cm | A$110 min 5 km² | A$210 min 25 km² |
| PERASCOPE stereo 30 cm | A$44 min 25 km² | A$76 min 100 km² |
| PERASCOPE tri-stereo 30 cm | A$66 min 25 km² | A$114 min 100 km² |
| BJ3N stereo 30 cm | A$50 min 15 km² | A$80 min 50 km² |
| BJ3N tri-stereo 30 cm | A$75 min 15 km² | A$120 min 50 km² |
| BJ3A stereo 50 cm | A$40 min 15 km² | A$66 min 50 km² |
| Vantor WorldView stereo 50 cm | A$50 min 5 km² | A$74 min 25 km² |
| Triple Sat stereo 80 cm | A$20 min 15 km² | Archive only |
Stereo you already hold
Surface model (DSM) · no minimum
A$6 / km²
Terrain model (DTM), added to the DSM
+A$2 / km²
Height above ground, with the DSM and DTM
Included
Prices are in Australian dollars per km² of your area, excluding tax. An area smaller than a sensor's minimum is billed at the minimum. Stereo tasking is booked with our team at the listed rate, and we confirm the delivery date for the elevation models when you order.
See the full price list in A$, US$ or € →
Invoicing, licensing and procurement terms are on the enterprise page.
Questions your GIS team will ask
What is the difference between a DEM, a DSM and a DTM?
DEM (digital elevation model) is the umbrella term. A DSM is the top surface, buildings and trees included. A DTM is the bare ground with those removed. Most requests for a DEM need one of the two, and a stereo order includes both, plus height above ground.
What vertical datum are the heights in?
EGM2008, the global geoid model. If you work in a local datum or projection, tell us when you order. Custom projections and formats are included in the price.
Can you build elevation models from stereo imagery we already hold?
Yes. A DSM from your own stereo pair or triplet is A$6 per km² with no minimum. A DTM adds A$2 per km², and height above ground comes with the pair.
How does satellite stereo compare with airborne LiDAR?
Stereo covers a large or remote area from one satellite pass, without sending an aircraft or a survey crew. It measures the ground it can see from both angles; under dense canopy the DTM is filled from the ground around it, and those cells are labelled. If you hold recent airborne LiDAR, send it and we will tie the models to it.
What happens where the satellite could not see the ground?
Cells with no consistent stereo match are left empty. At Kimberley that was 19 ha of the deepest pit floors. Cells filled under buildings and canopy carry a reason code, so you can keep or drop them.
Which satellites can collect stereo?
Every sensor in the stereo price list on this page, from 30 cm to 80 cm. All of them have archive stereo, and most can be tasked for new collections. Tri-stereo adds a third look, which cuts down the ground hidden behind tall buildings and steep slopes.
See it over your own site
Apply for a sample and we'll arrange a short call to understand what you need to see, then build the elevation models over your area with their accuracy report. If you'd rather start with numbers, draw your area in Pera Portal for the per-km² price.